Investor Relations
Financial Highlight 2024
| FINANCIAL YEAR ENDED | Audited 30-Nov 2024 | Audited 30-Nov 2023 | Audited 30-Nov 2022 | Audited 30-Nov 2021 | Audited 30-Nov 2020 Restated |
||||||||||||||||||||||||||||||
| Financial Results | |||||||||||||||||||||||||||||||||||
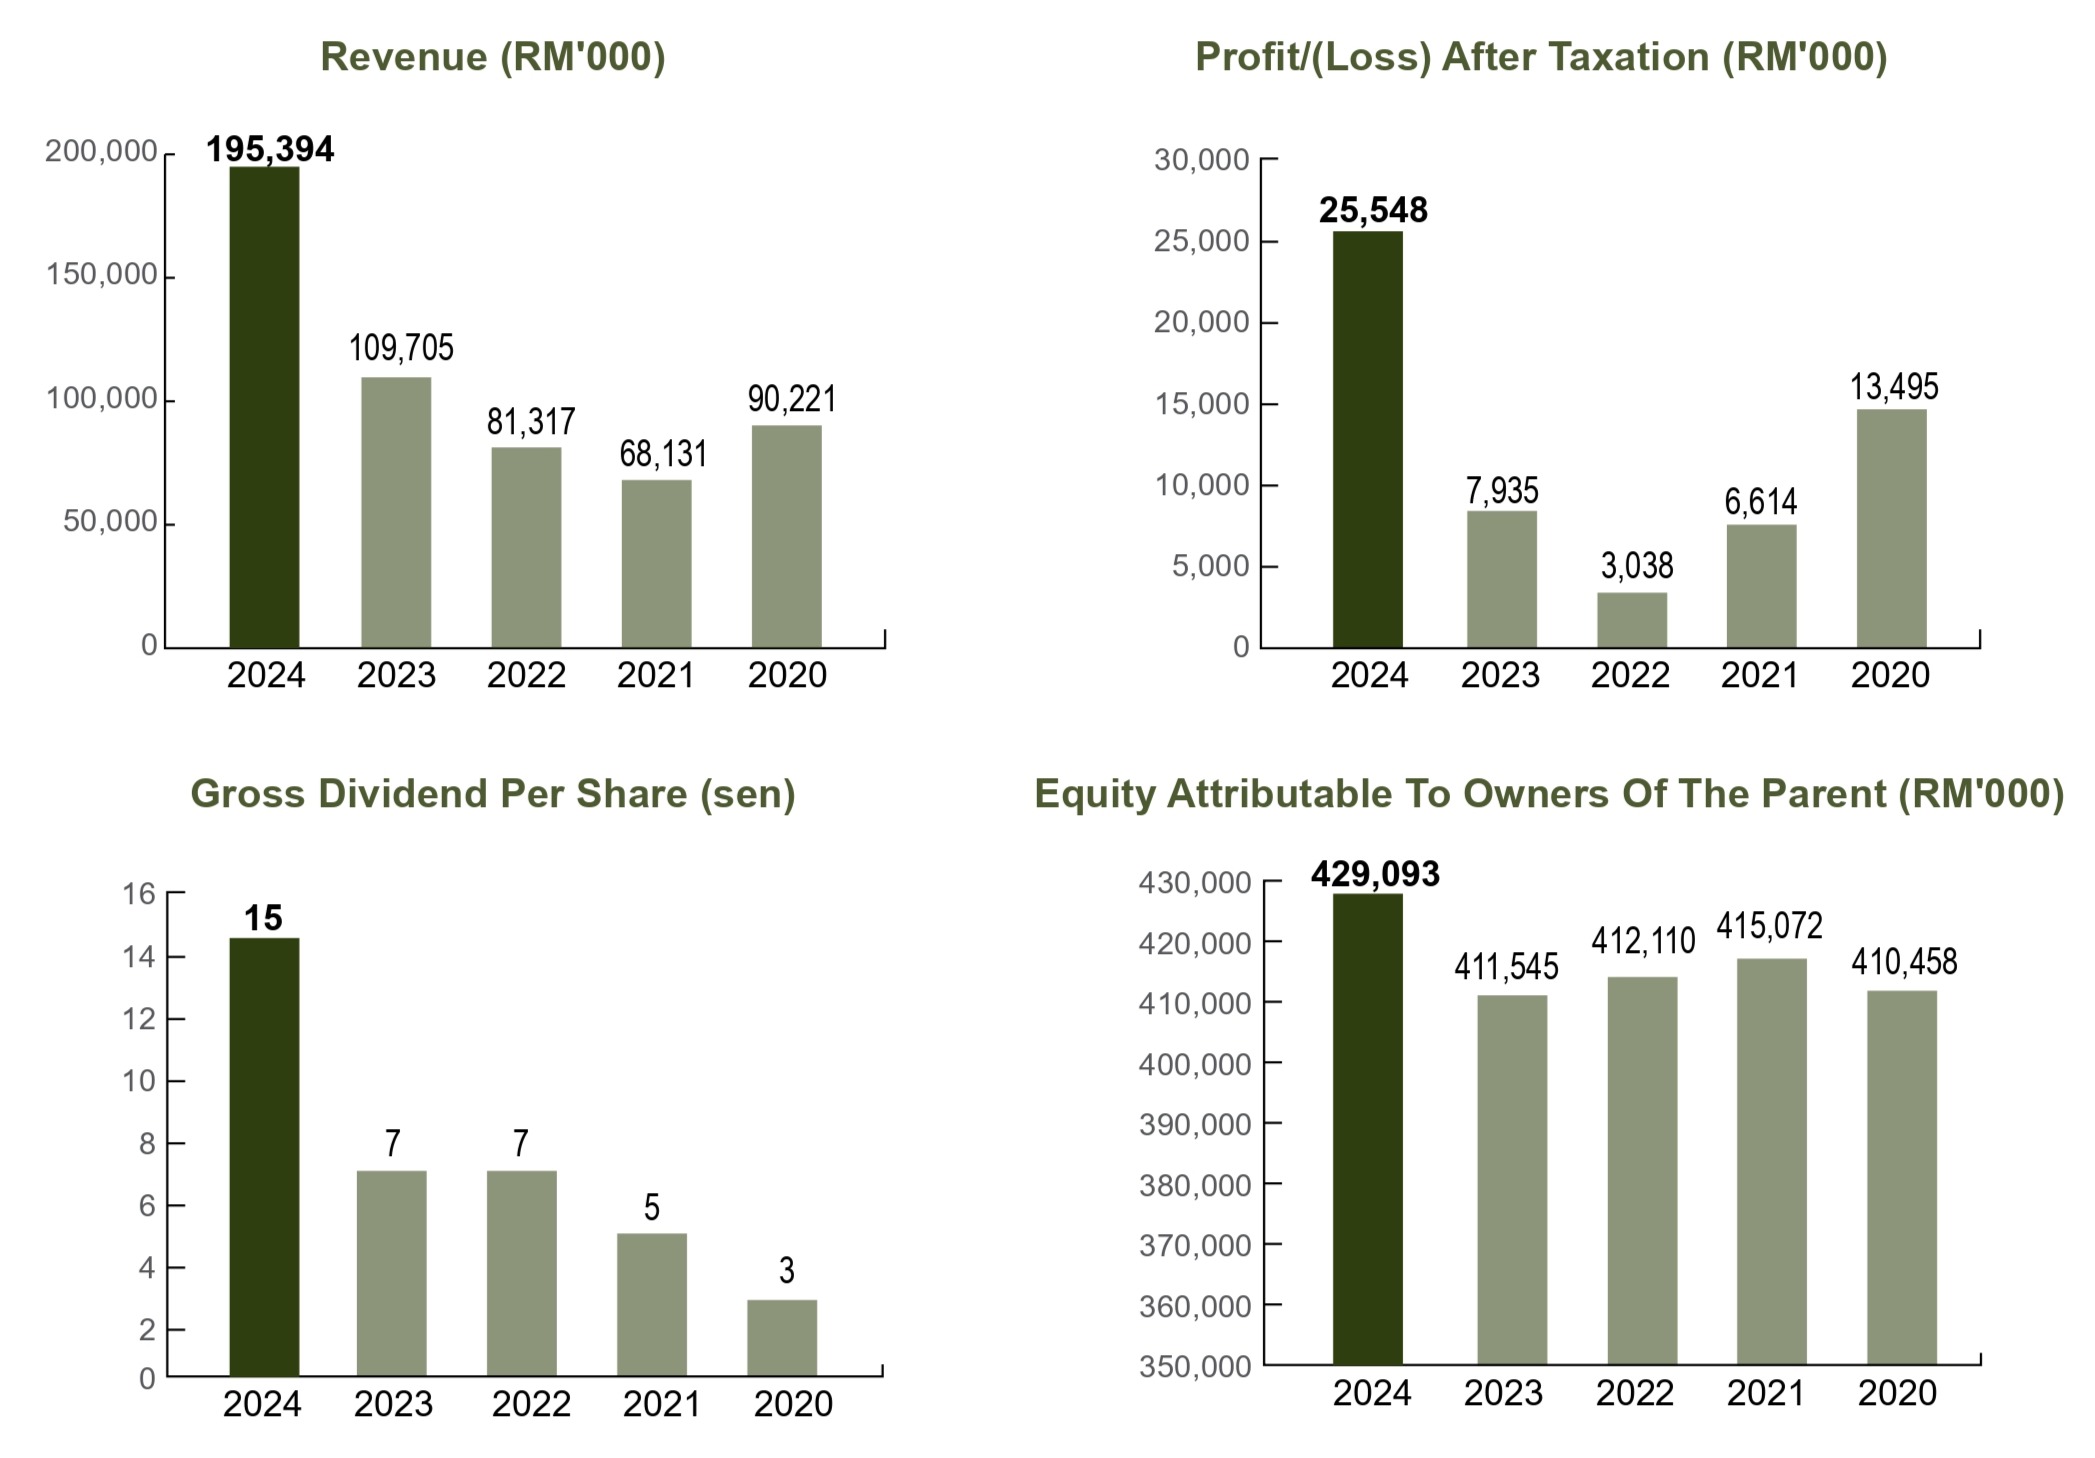
| Revenue (RM'000) | 195,394 | 109,705 | 81,317 | 68,131 | 90,221 | ||||||||||||||||||||||||||||||
| Profit Before Taxation (RM'000) | 31,978 | 11,960 | 4,132 | 9,993 | 19,916 | ||||||||||||||||||||||||||||||
| Profit After Taxation (RM'000) | 25,548 | 7,935 | 3,038 | 6,614 | 13,495 | ||||||||||||||||||||||||||||||
| Gross Dividend Per Share (sen) | 15 | 7 | 7 | 5 | 3 | ||||||||||||||||||||||||||||||
| Financial Position | |||||||||||||||||||||||||||||||||||
| Total Cash, Bank Balance and Deposit (RM'000) |
4,006 | 6,575 | 7,166 | 20,317 | 14,185 | ||||||||||||||||||||||||||||||
| Total Assets (RM'000) | 706,428 | 692,862 | 677,286 | 667,638 | 676,444 | ||||||||||||||||||||||||||||||
| Total Borrowings (RM'000) | 171,896 | 216,536 | 209,932 | 204,994 | 222,745 | ||||||||||||||||||||||||||||||
| Share Capital (RM'000) | 100,124 | 100,124 | 100,124 | 100,124 | 100,124 | ||||||||||||||||||||||||||||||
| Reserve (RM’000) | 328,969 | 311,421 | 311,986 | 314,948 | 310,334 | ||||||||||||||||||||||||||||||
| Equity Attributable To Owners Of The Parent (RM'000) |
429,093 | 411,545 | 412,110 | 415,072 | 410,458 | ||||||||||||||||||||||||||||||
| Financial Ratios | |||||||||||||||||||||||||||||||||||
| Basic Earnings Per Share (sen) | 25.55 | 7.94 | 3.04 | 6.61 | 13.50 | ||||||||||||||||||||||||||||||
| Net Assets Per Share Attributable To Owners Of The Parent (RM) |
4.29 | 4.12 | 4.12 | 4.15 | 4.10 | ||||||||||||||||||||||||||||||
| Return On Equity (%) | 7.45 | 2.91 | 1.00 | 2.41 | 4.85 | ||||||||||||||||||||||||||||||
| Gearing Ratio (times) | 0.40 | 0.53 | 0.51 | 0.49 | 0.54 | ||||||||||||||||||||||||||||||